Unit 6 - K-Means Clustering Analysis
K-Means Clustering Tutorial
This tutorial demonstrates the application of K-Means clustering to analyze three different datasets: Iris, Wine, and WeatherAUS. The analysis is performed using Python with libraries such as pandas, numpy, matplotlib, and scikit-learn.
Learning Outcomes
- Understand K-Means clustering and its application to real datasets
- Preprocess data for clustering
- Evaluate clustering results with respect to known labels
- Reflect on legal, social, ethical, and professional issues in machine learning
Task A: K-Means Clustering on Iris Dataset
Data Loading and Preprocessing
# Import required libraries
import pandas as pd
import numpy as np
import matplotlib.pyplot as plt
from sklearn.cluster import KMeans
from sklearn.metrics import confusion_matrix, accuracy_score
from sklearn.preprocessing import StandardScaler, LabelEncoder
from sklearn.decomposition import PCA
import seaborn as sns
# Load Iris data
iris = pd.read_csv('Unit06 iris.csv')
# Remove non-numeric columns (keep only features)
iris_features = iris.select_dtypes(include=[np.number])
# Store true labels for comparison
if 'species' in iris.columns:
iris_labels = iris['species']
else:
iris_labels = None
# Standardize features
scaler = StandardScaler()
iris_scaled = scaler.fit_transform(iris_features)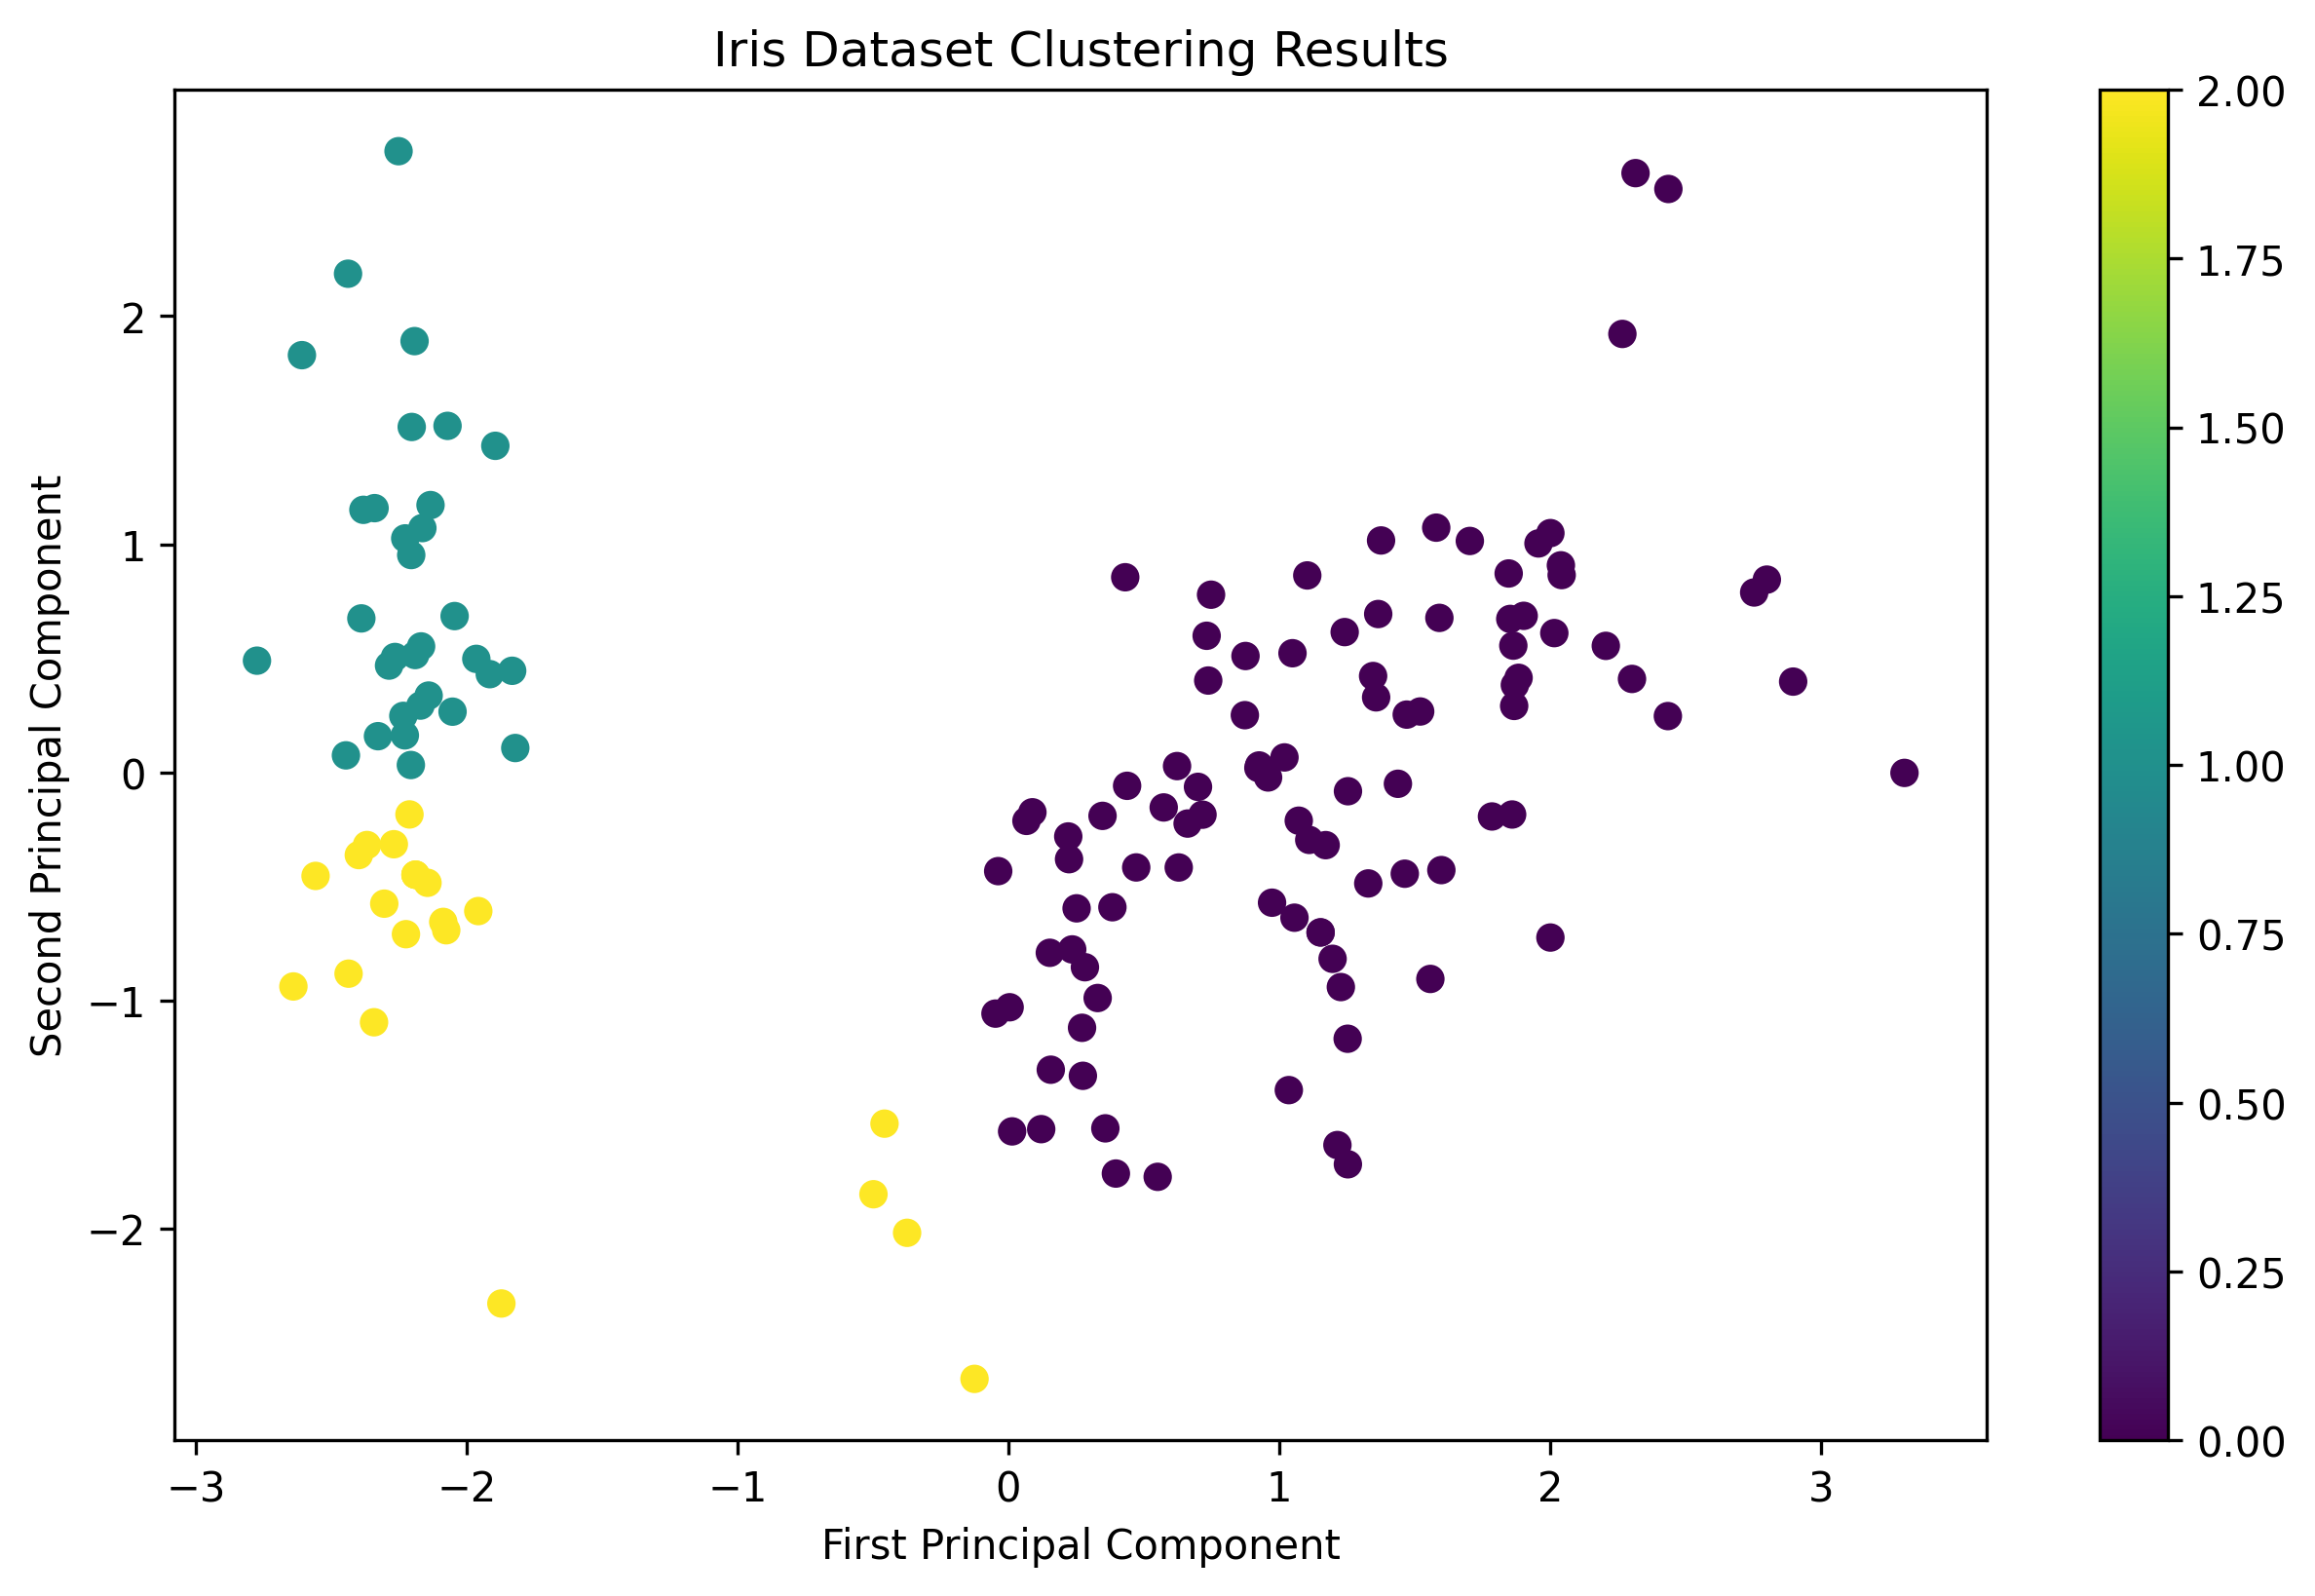 Iris Dataset Clustering Results
Task B: K-Means Clustering on Wine Dataset
Data Loading and Preprocessing
# Load Wine data
wine = pd.read_csv('Unit06 wine.csv')
# Remove non-numeric columns
wine_features = wine.select_dtypes(include=[np.number])
# Store true labels for comparison
if 'class' in wine.columns:
wine_labels = wine['class']
else:
wine_labels = None
# Standardize features
wine_scaled = scaler.fit_transform(wine_features)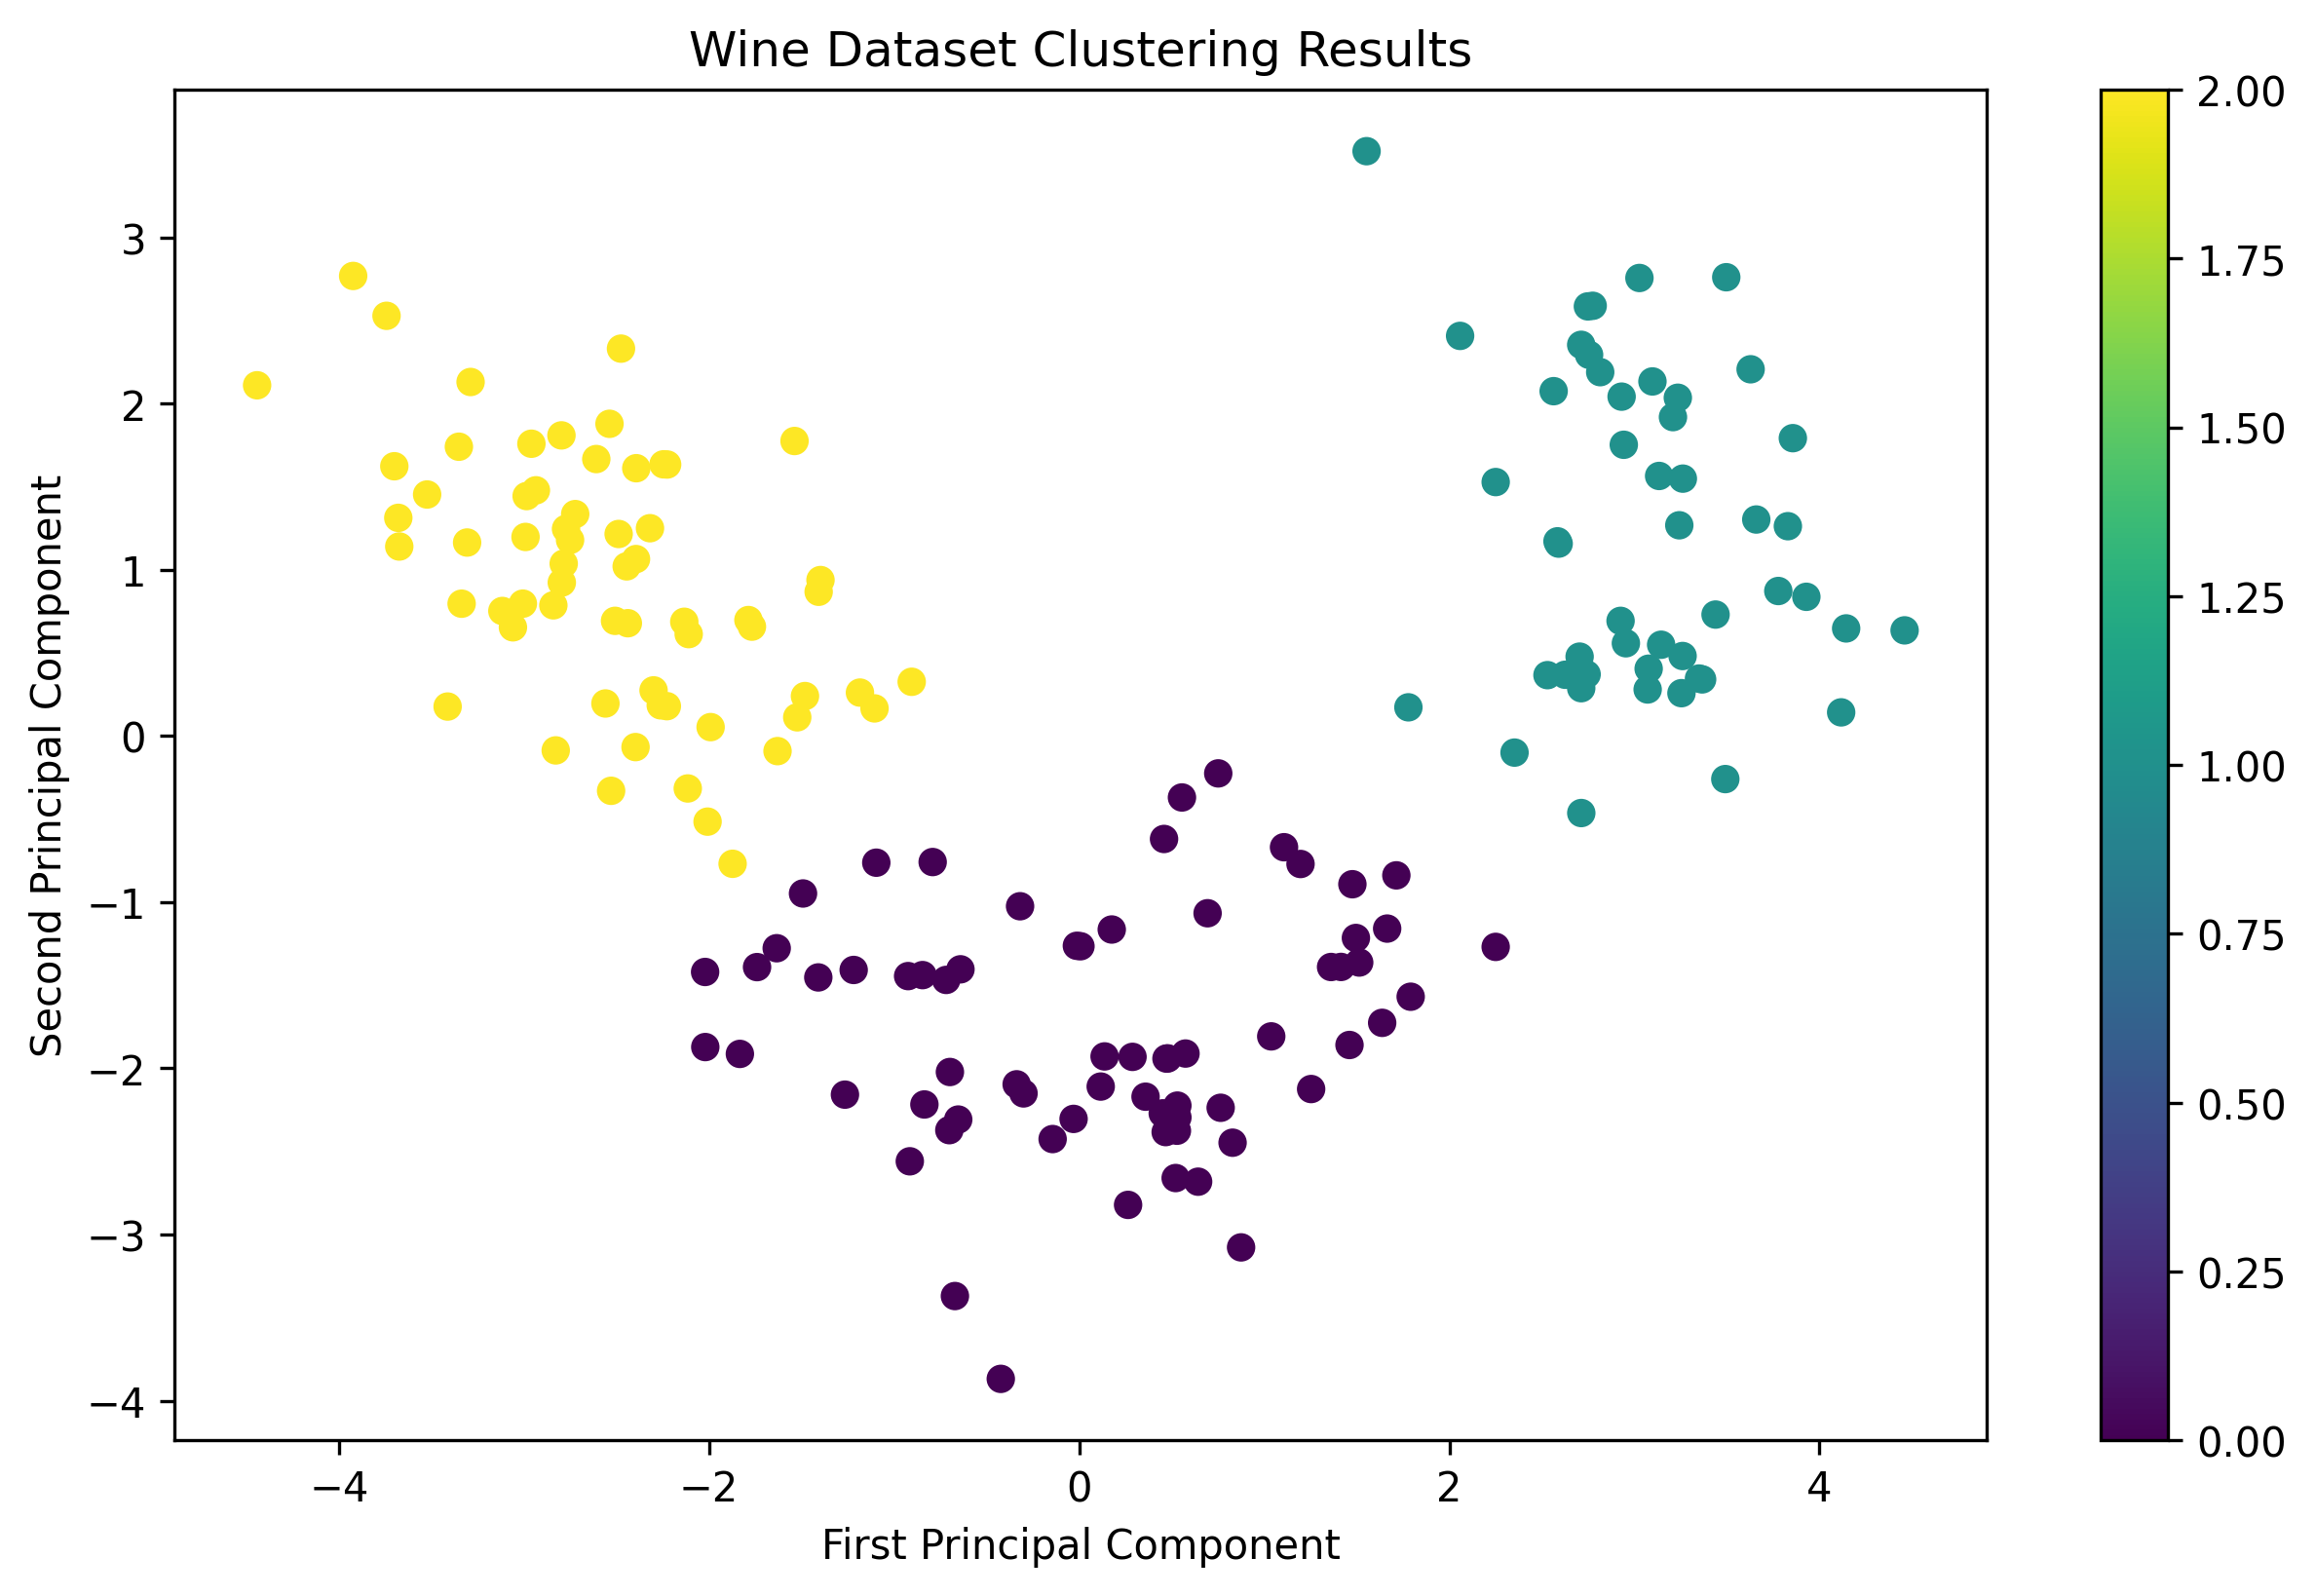 Wine Dataset Clustering Results
Task C: K-Means Clustering on WeatherAUS Dataset
Data Loading and Preprocessing
# Load WeatherAUS data
weather = pd.read_csv('Unit06 weatherAUS.csv')
# Remove non-numeric and irrelevant columns
weather_features = weather.select_dtypes(include=[np.number])
weather_features = weather_features.drop(['Date', 'Location'], axis=1)
# Handle missing values
weather_features = weather_features.fillna(weather_features.mean())
# Standardize features
weather_scaled = scaler.fit_transform(weather_features)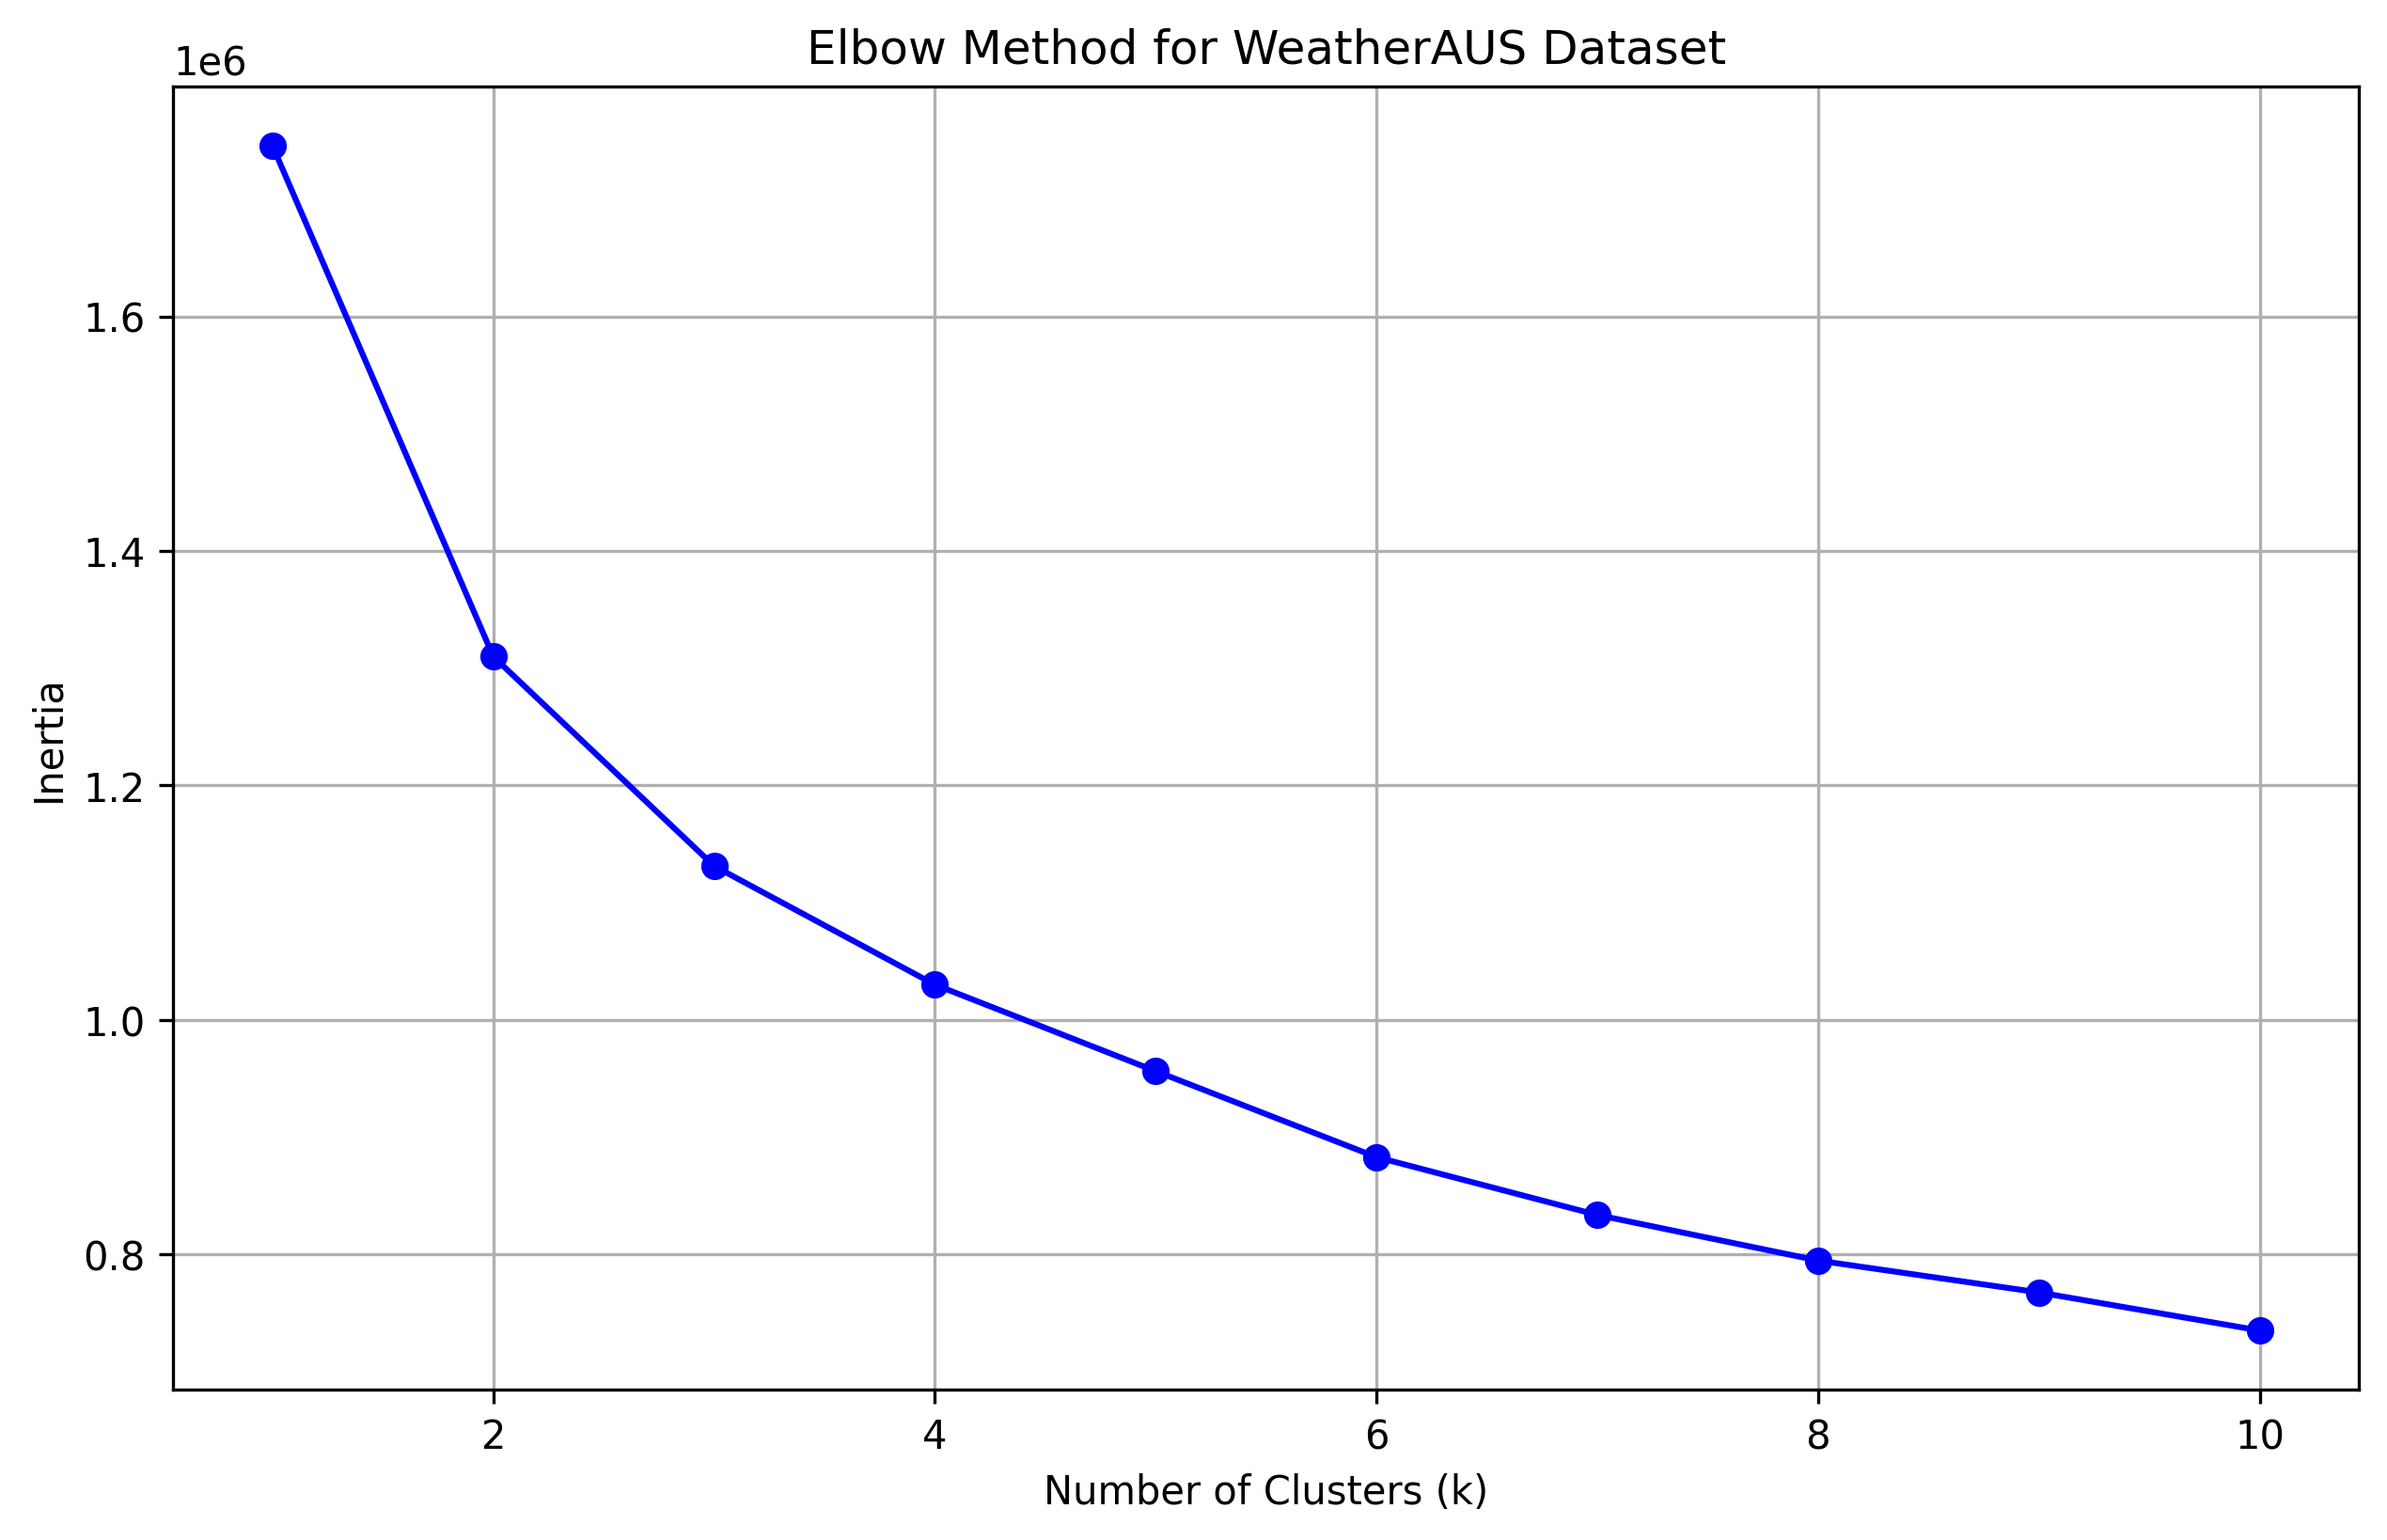 WeatherAUS Dataset Elbow Plot
Key Findings
- The Iris dataset showed clear clustering patterns that aligned well with the known species labels
- The Wine dataset demonstrated moderate clustering performance, with some overlap between classes
- The WeatherAUS dataset required careful preprocessing and the elbow method helped determine the optimal number of clusters
- Feature standardization and dimensionality reduction were crucial for effective clustering